How It Works
From Raw PDF to Structured Excel
Most financial PDFs weren't designed for analysis. Tables break across pages, units shift, and formatting changes from file to file. DealSheets.ai handles that complexity automatically so you can focus on interpretation, not cleanup.
Step 1: Upload & Select Pages
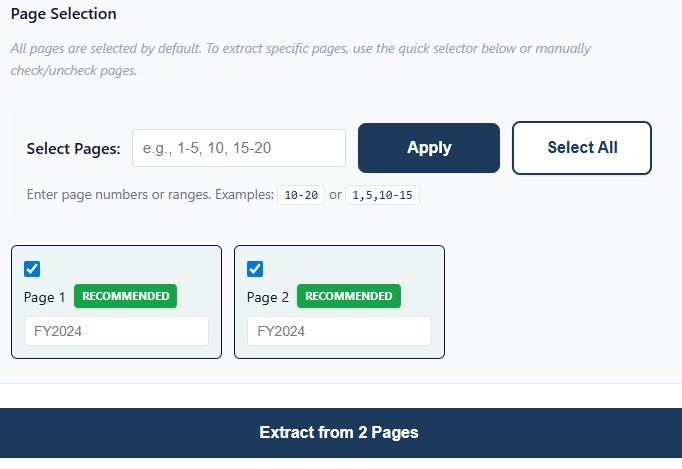
Upload one or more PDFs containing monthly financial statements through our secure interface.
For single large PDFs (like CIMs), select specific pages containing your financial tables. Perfect for extracting monthly P&Ls across multiple years — when Jan-Dec 2021 is on page 55, Jan-Dec 2022 on page 56, and Jan-Dec 2023 on page 57.
Each file is scanned and preprocessed. If your statements are scanned images, the system automatically applies OCR to make them machine-readable.
Supports:
- Single or bulk PDF uploads
- Page-level selection from large PDFs
- Multi-year monthly data consolidation
- Automatic chronological ordering (Jan-21 through Dec-23)
Step 2: Table Detection
Our engine reviews each selected page to identify financial tables with period-based columns (monthly, quarterly, or annual data).
The system detects Income Statements by identifying common line items like revenue, COGS, gross profit, and EBITDA, then classifies tables by statement type.
Step 3: Table Extraction
Each detected table is extracted using multiple parsing methods to ensure accuracy.
We combine outputs from pdfplumber and Camelot in both lattice and stream modes, then compare results and choose the highest-confidence version.
Common accounting structures are recognized automatically, including:
- Multi-line headers
- Subtotals and sections
- Negative values in parentheses
- Continuations across pages
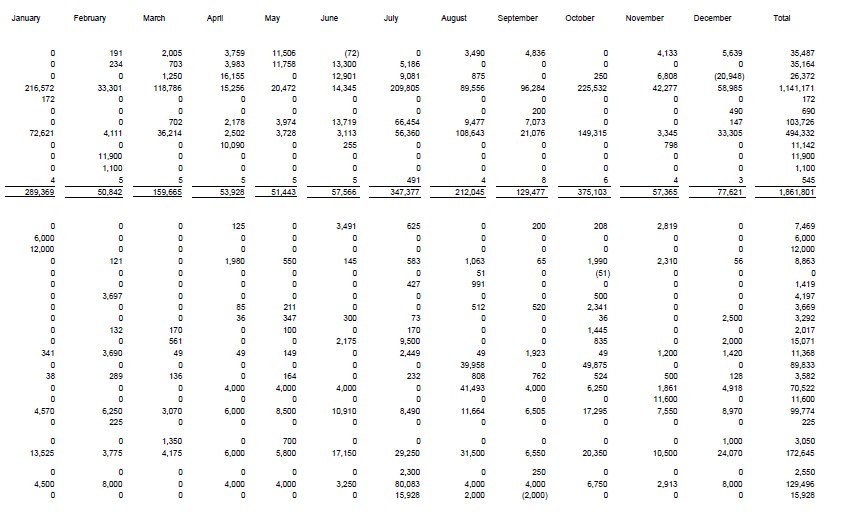
Step 4: Smart Consolidation
When multiple Income Statements are selected — whether from different pages in one PDF, multiple separate files, or different time periods — the system intelligently merges them into a single horizontal view.
Line items are matched using section-aware logic that preserves legitimate duplicates (like "Business to Consumer" appearing in both revenue and COGS sections).
The result is a single consolidated Excel sheet. For multi-year monthly data, all periods appear horizontally: Jan-21, Feb-21, ..., Dec-21, Jan-22, ..., Dec-23.
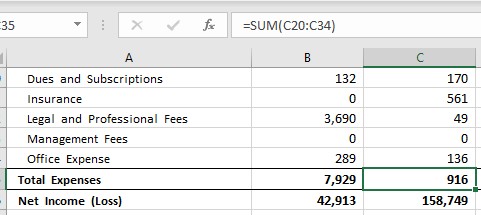
Step 5: Validation and Formula Generation
Before export, the system performs consistency checks on total lines:
- Identifies subtotal rows (Net Sales, Total COGS, EBITDA, etc.)
- Generates Excel formulas to validate that totals sum correctly
- Provides month-over-month analysis for trend detection
- Creates a validation sheet comparing PDF values vs. calculated formulas
Results include color-coded indicators showing where PDF values match or differ from formula calculations.
Step 6: Excel Generation
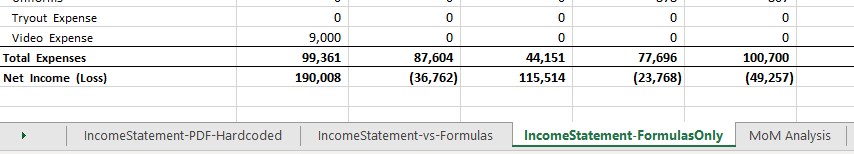
Your final Excel workbook includes:
- Main sheet: Consolidated Income Statement with all periods horizontally merged
- Validation sheet: Formula-based cross-checks comparing PDF values to calculated totals
- Formulas-only sheet: Same structure with all values as Excel formulas for model integration
- MoM Analysis: Month-over-month change calculations for trend analysis
- Clean number formatting, accounting-style negatives (parentheses), and proper section hierarchy
Step 7: Download and Review
Once processing is complete, download your Excel workbook with all periods consolidated into a single view.
Every number is traceable back to the source PDF, ready for analysis, modeling, or integration into existing workflows. No manual re-typing, no copy-paste errors.
Why It Works
DealSheets.ai was designed by operators who have lived both sides of the table — CEOs running portfolio companies and deal teams reviewing them. The system reflects years of firsthand experience with financial data, built to eliminate the slowest manual step in the transaction process.
Ready to Try It?
Upload your first PDF and see how accurate automation can be.